Period Stats
Overview
The Period Stats page allows properties to generate reports that provide an overview of important statistics such as the number of bookings from a channel over a particular date range. Period stat reports can be selected by specific channels or alternatively all channels can be viewed at once if required.
The Period Stats provide the functionality for the property to create Custom Periods or Monthly Reports
How to manage Period Stats for your property
To download your report, go to “Reporting” – Period Stats
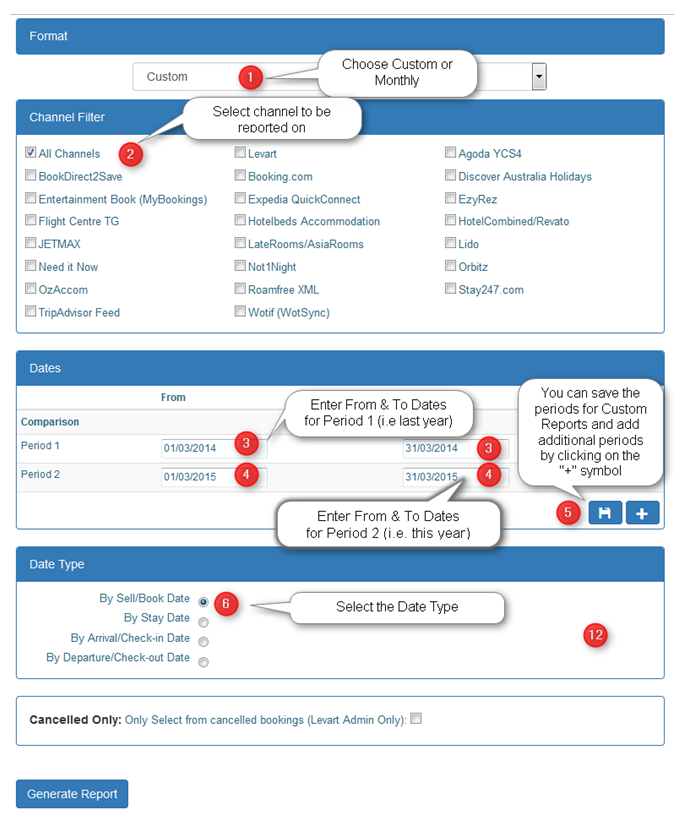
This will then show 4 valid fields that will need to be selected.
Format
Permits the choice of Custom Reports or Monthly Reports
Custom reports | Create reports with any date range for Period 1 and period 2. This would be daily, weekly of set number of days for each period. Custom reports periods once created can be saved for later report generation. |
Monthly Reports | Enter an extended date range i.e. Period 1 1 July 2013 to 30 June 2014 Period 2 1 July 2014 to 30 June 2015 The report will be generated by month. |
Channel Filter
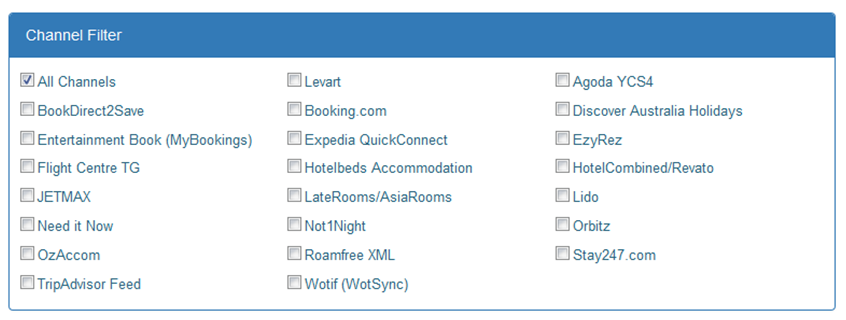
The channel filter function allows you to select which particular third party sites you would like to compare data with. By selecting All Channels this will compare data with all third party sites that you have active within Levart. Otherwise selecting individual Third party Sites for example Levart, Wotif and Booking.com you will then be shown the statistics to compare against each other.
Dates
Custom Reports
Click in the date field to create the rate periods. For custom you need to select the format dd/mm/yyyy.
Monthly Reports
Click in the date field to create the rate periods. For Monthly Stats the month and year.
Date Type
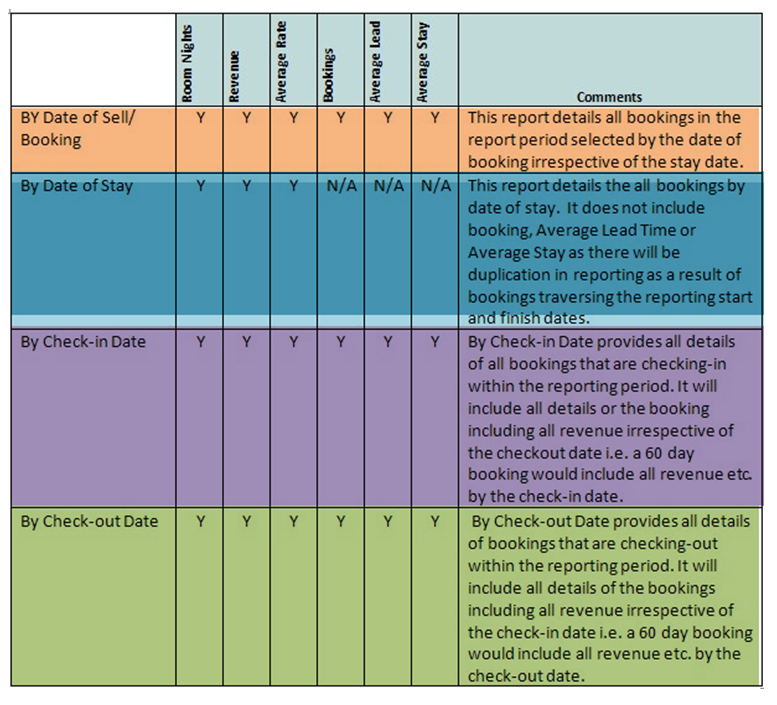
Please see screenshot below which explains each date type options to choose from
Sell/Book Date, Stay Date, Arrival/Check-in Date and Departure/Check-out Date
These reports are available for both Custom and Monthly
Create a report
Period Stats is designed to compare two periods. Enter the relevant dates you would like compared in the Period 1 and Period 2 date boxes.
Open Period Stats Excel spreadsheet
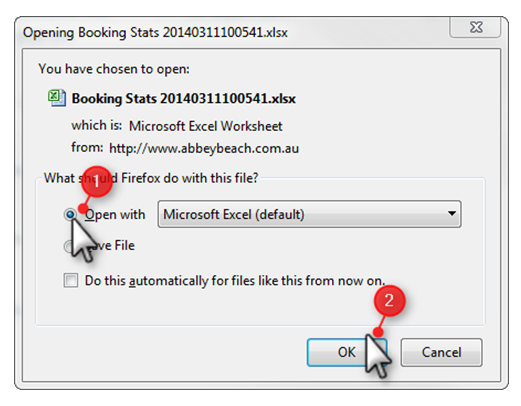
Once you have selected Generate a pop up will appear asking you to select save or open file. Open file with Microsoft Excel which you can then save later on. Then select ‘OK’
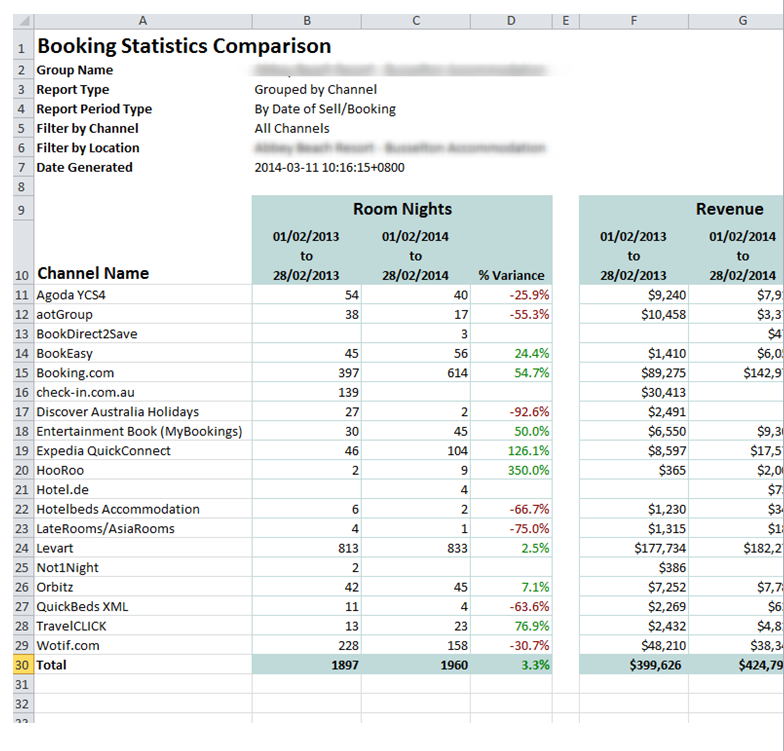
Below is an example of how the period stat document will appear in Excel format.
You will need to click on the enable button on the browser to make changes to the spreadsheet
Filter by Channel, Filter by Location and the Date and time the document was processed.
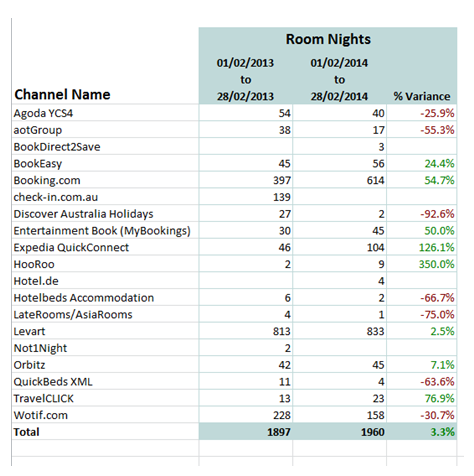
Room Nights
The Room Nights table will compare the amount of rooms booked for the date period selected. For example the screenshot below shows that for 2013 Agoda averaged 54 rooms whereas 2014 the average is 40 rooms so the variance for this date generated would be a low of 25.9% for Agoda. However for 2013 Booking.com had an average 397 and for 2014 was a lot higher at 614 rooms. This would make the variance at a higher percentage of 54.7%.
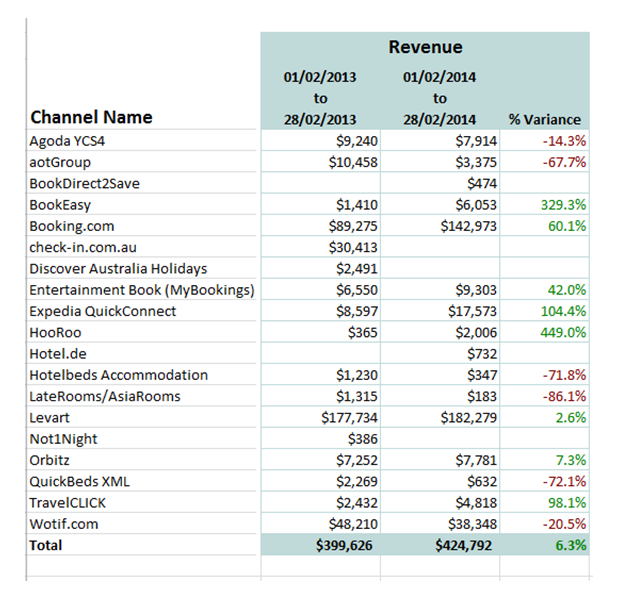
Revenue
The Revenue table will compare the amount of money which was made on each third party site from the generated date range selected. The first column will show the amount made in the start period, second column will show the end comparing period. The third column will then calculate these periods to find the average variance which will either display a low variance in RED or a higher variance in GREEN. For example see screenshot below.
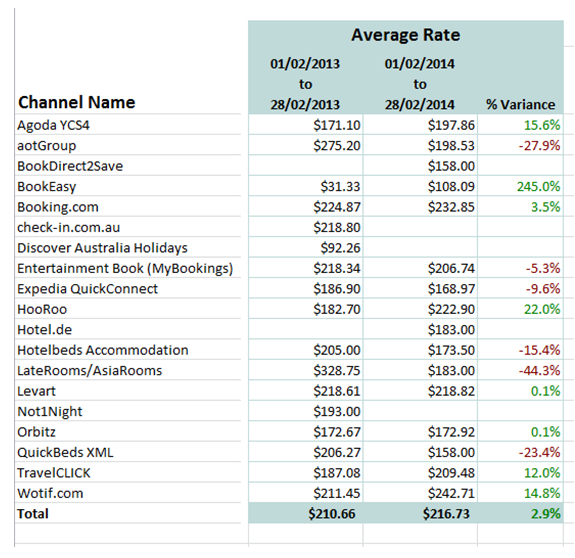
Average Rate
The Average Rate table will compare the rate that was sent across to the third party site from the generated date range selected. The first column will show the rate in the start period, second column will show rate that was sent at the end comparing period. The third column will then calculate these periods to find the average variance which will either display a low variance in RED or a higher variance in GREEN. For example see screenshot below.
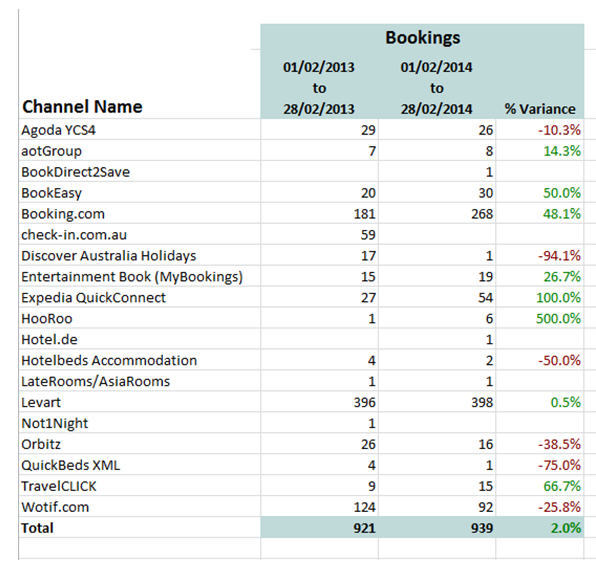
Bookings
The Bookings table will compare the amount of bookings on the third party site from the generated date range selected. The first column will show the rate in the start period, second column will show rate that was sent at the end comparing period. The third column will then calculate these periods to find the average variance which will either display a low variance in RED or a higher variance in GREEN. For example see screenshot below.
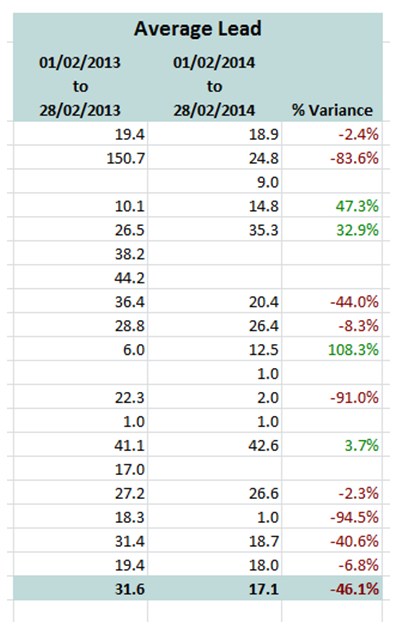
Average Lead
The Average Lead table will compare the average time it takes from when a guest makes a booking to the date that they plan to stay on the third party sites from the date range selected. The first column will show the rate in the start period, second column will show rate that was sent at the end comparing period. The third column will then calculate these periods to find the average variance which will either display a low variance in RED or a higher variance in GREEN. For example see screenshot below.
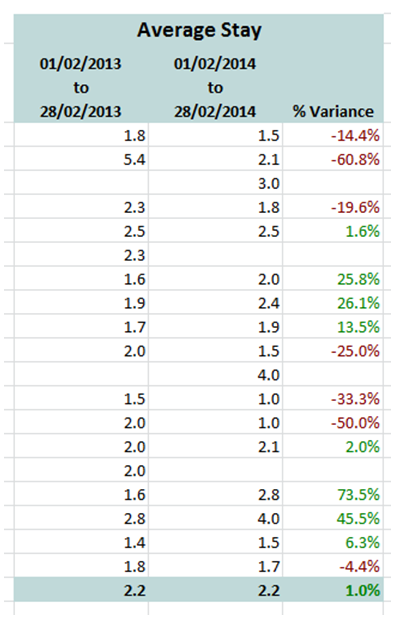
Average Stay
The Average Stay table will compare how many nights on average guests will stay at the property from the date range selected. The first column will show the rate in the start period, second column will show rate that was sent at the end comparing period. The third column will then calculate these periods to find the average variance which will either display a low variance in RED or a higher variance in GREEN. For example see screenshot below.
If you are unsure of how to complete a particular section or are experiencing any difficulties with this setup, please feel free to contact Levart Support on 08 9382 8001 or at support@levart.com.au

